How to Measure Training Effectiveness: A Practical Guide
To understand if your training actually works, you have to look beyond completion rates. It’s a common mistake to assume that a high completion percentage equals success. A report showing 95% of employees finished a course looks impressive, but it reveals very little about its true impact.
Did behaviors change? Did performance improve? Did the training move the needle on key business metrics? Those are the questions that matter.
Defining What Real Training Success Looks Like

Focusing on activity metrics—like hours logged or modules completed—creates a false sense of accomplishment. True success is about driving tangible change that is tied directly to business objectives.
Therefore, before you can measure anything, you must define what success means in concrete, performance-based terms.
It’s About Outcomes, Not Activity
The first essential shift is moving from an activity mindset to an outcome mindset. Stop asking, "Did they finish the training?" and start asking, "What can they do now that they couldn't do before?"
This requires a strategic discussion with stakeholders before any training content is developed. You need to pinpoint the specific business problem you are trying to solve. Is the company losing money from product defects? Are customer service resolution times lagging? Or are you facing a compliance gap with new safety protocols?
Here’s the bottom line: You must be able to draw a straight, undeniable line from the training content to a measurable business result. If you cannot clearly state how the training will solve a specific operational challenge, you will struggle to prove its value.
Setting Clear Benchmarks for Success
Once you have identified the business problem, the next step is to set clear, specific benchmarks. These goals must be measurable and directly linked to performance. Think less "improve skills" and more along the lines of:
- Reduce machine setup errors by 15% within 60 days of training.
- Increase the first-call resolution rate for new support agents by 20% in their first quarter.
- Achieve 100% compliance with new safety procedures, verified through on-the-job observations.
Getting this right from the start is critical. Global corporate training spend increased significantly after 2020, reaching an estimated $923 billion. Yet, some research suggests a staggering 40% of these programs fail to produce any noticeable performance improvement. A primary reason for this is that outcomes were never properly defined or measured. You can read more research about the impact of training assessment to dig deeper.
By setting clear goals upfront, you are not just creating a training program; you are building a business case. You are laying the foundation for a measurement strategy that justifies the investment and proves that your work makes a real impact.
Choosing the Right Measurement Framework
Once your goals are defined, you need a reliable roadmap to determine if you are meeting them. Instead of inventing a new method from scratch, it is more efficient to use a proven framework. A solid structure helps you assess the entire learning journey, from a trainee's initial reaction to the bottom-line business impact.
One of the most trusted and enduring frameworks is the Kirkpatrick Four-Level Training Evaluation Model. Developed in the 1950s by Donald Kirkpatrick, its practical, step-by-step approach is why it remains the foundation for over 60% of corporate L&D programs worldwide.
Measurement is not an afterthought; it is a deliberate sequence that begins before the training.
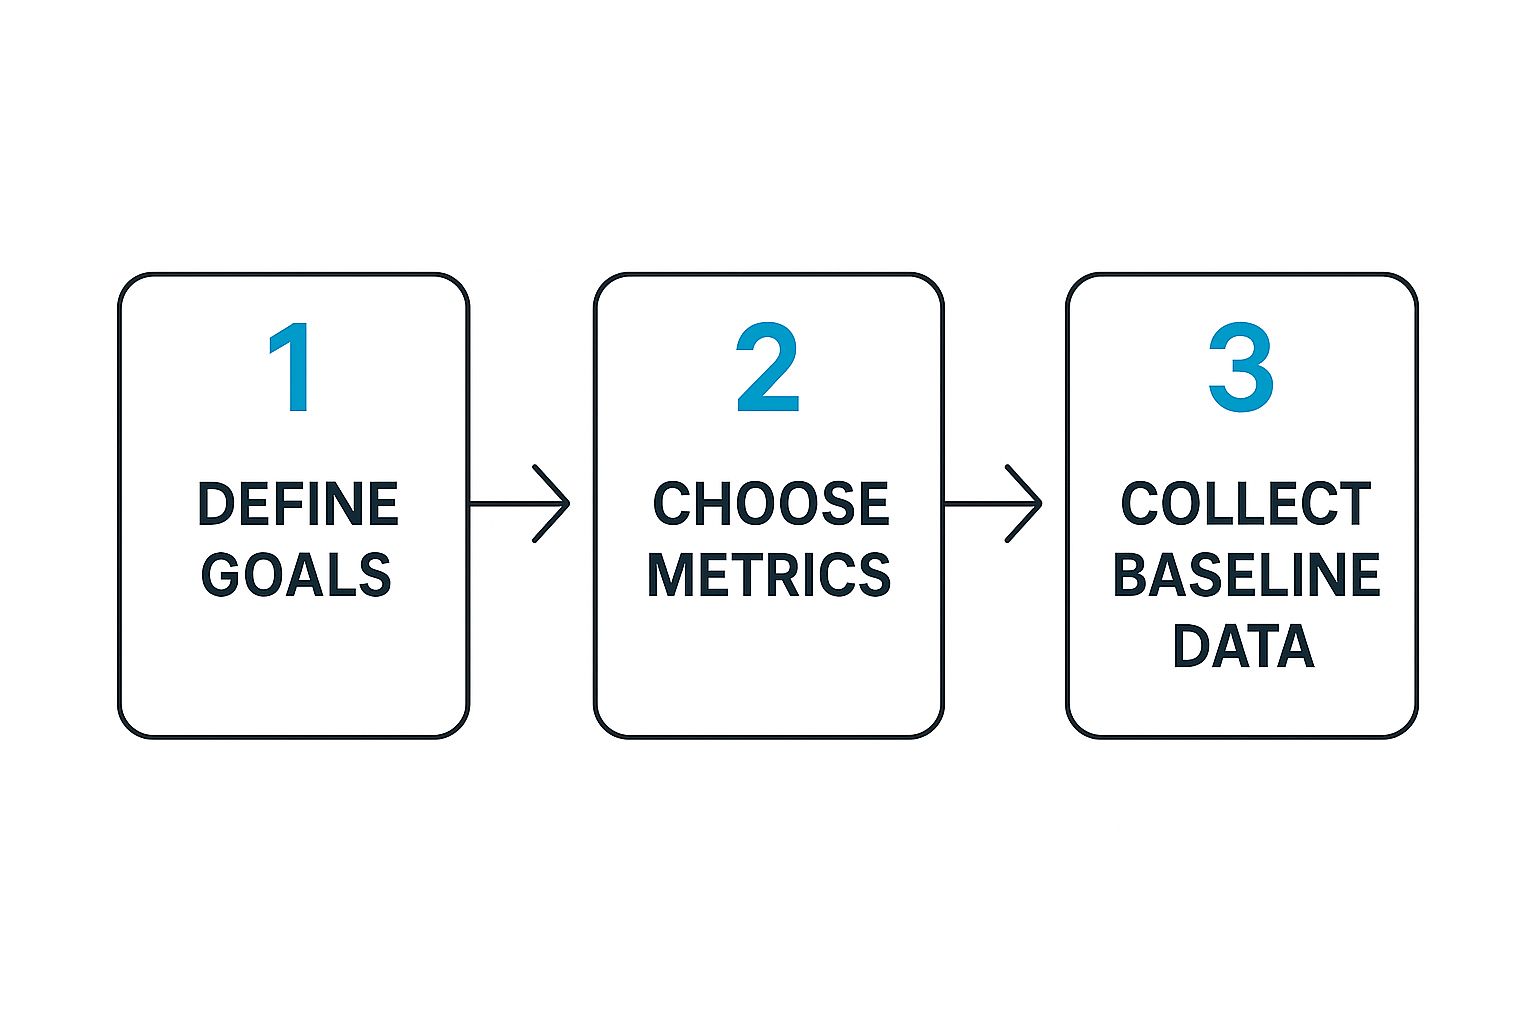
As you can see, you must define what success looks like and determine how you will track it before the training module begins. It is all about being intentional.
The Four Levels of the Kirkpatrick Model
The value of the Kirkpatrick model lies in its clear, progressive path. Each level builds on the one before it, providing an increasingly complete picture of your training's real-world impact.
Let’s break it down.
| The Four Levels of the Kirkpatrick Model |
| :— | :— | :— |
| Level | What It Measures | Example Measurement Tools |
| Level 1: Reaction | How participants felt about the training. Was it engaging, relevant, and well-delivered? | Post-training surveys, "happy sheets," feedback forms, informal interviews. |
| Level 2: Learning | The increase in knowledge, skills, or even confidence. Did they actually learn something? | Pre- and post-training assessments, quizzes, skill demonstrations, practical tests. |
| Level 3: Behavior | If participants are applying what they learned back on the job. Is the new knowledge being used? | On-the-job observations, manager feedback, peer reviews, performance data (30-90 days post-training). |
| Level 4: Results | The impact on tangible business outcomes. Did the training move the needle on our KPIs? | KPI analysis (e.g., error rates, sales figures, safety incidents, customer satisfaction scores). |
Working through these levels takes you from a simple check on engagement to hard data on business results. It’s a comprehensive way to connect the dots between learning and performance.
Adding a Financial Lens with the Phillips ROI Model
The Kirkpatrick model is highly effective, but sometimes the C-suite needs to see the numbers in dollars and cents. For that, you can turn to the Phillips ROI Model. It incorporates everything from Kirkpatrick and adds a crucial fifth level.
Level 5: ROI. This level calculates the program's monetary value by comparing its total cost to its financial benefits. It answers the ultimate stakeholder question: "For every dollar we invested, how many did we get back?"
Calculating ROI requires you to isolate the effects of the training from other factors, such as a new marketing campaign or a change in the market. You then assign a monetary value to the improvements. For instance, what is the financial upside of a 10% reduction in safety incidents or a 5% boost in production speed? This level helps you determine that.
Ultimately, picking the right framework is about understanding the art and science of measuring what matters in the workplace.
By adopting a model like Kirkpatrick or Phillips, you give yourself a structured, defensible process. You are no longer just saying the training was "good"—you are proving its value with a clear, logical story backed by data.
Selecting KPIs That Align With Business Goals

Having a solid framework like Kirkpatrick is an excellent start, but it is just a blueprint. To truly prove your training's worth, you need the right building blocks—and that means picking Key Performance Indicators (KPIs) that connect learning directly to what the business values.
If you do not choose the right metrics, you end up measuring effort, not impact. It is easy to get lost in immediate, easy-to-track numbers, but the real value is in telling a complete story. You need a mix of metrics that connects the dots from the training session all the way to the company's bottom line. The first step is understanding the difference between two types of indicators.
Differentiating Leading and Lagging Indicators
Leading indicators are the metrics you can capture right away, either during or immediately after the training. They are early signals that suggest future success but do not prove it on their own. Think of them as breadcrumbs showing you are on the right path.
On the other hand, lagging indicators are the results that emerge over time. These are the numbers that executives and department heads value because they show real-world performance changes and business impact. They are the proof that your leading indicators were pointing in the right direction.
Key Takeaway: You need both. Leading indicators offer early feedback so you can fine-tune your program. Lagging indicators deliver the ultimate proof of ROI. Relying only on leading indicators is like celebrating a great practice session without ever checking the final score of the game.
Building Your KPI Scorecard
The KPIs you select should be tailored to your training's specific objective. A one-size-fits-all list of metrics is a recipe for failure. You must customize them to the skills and business goals at hand.
Here are a few real-world examples:
-
For Sales Training
- Leading: Passing scores on product knowledge quizzes, successful completion of role-playing scenarios.
- Lagging: Higher average deal size, shorter sales cycles, better lead-to-close conversion rates.
-
For Safety Training
- Leading: 100% completion of mandatory compliance modules, high scores on hazard identification tests.
- Lagging: A measurable drop in workplace incidents, fewer days lost to injury, lower insurance premiums.
-
For Software Adoption
- Leading: Faster task completion times in the new software, high scores on feature navigation tests.
- Lagging: Fewer support tickets logged, more daily active users, quicker data entry speeds.
Effective strategies use a mix of quantitative and qualitative data. While completion rates are a common starting point—successful programs often top 85%—the real story is in what happens next. Post-training quizzes often reveal knowledge retention between 60% and 80%, which is a crucial leading indicator.
This is where modern technology provides a significant advantage. Immersive training simulations, for example, can capture incredibly granular performance analytics. To understand the depth of this data, it's worth reading about the benefits of virtual reality training, which can track data points that are simply impossible to capture with traditional methods.
By building a balanced scorecard with the right KPIs, you stop creating simple reports and start telling a powerful story about your training's real value.
How to Collect Actionable Training Data
Knowing what to measure is half the battle. The other half is actually obtaining reliable data. To genuinely gauge training effectiveness, you need a smart mix of methods that capture everything from initial reactions to long-term behavioral changes on the job. It is about building a complete picture, which requires pulling from multiple, trustworthy sources.
One of the biggest mistakes is forgetting to establish a performance baseline before any training starts. How can you prove your program made a difference if you do not know what "normal" looked like? A solid baseline provides that clear before-and-after snapshot, making it much easier to show a direct link between the training and the results.
Designing Effective Feedback Mechanisms
Post-training surveys are a classic tool for a reason, but they must be designed thoughtfully to yield useful information. Do not just ask, "Did you like the training?" That question provides little insight. You need to dig deeper with targeted questions. A blend of question types—such as Likert scales, multiple-choice, and open-ended comments—provides the best mix of quantitative data and rich, qualitative feedback.
Try asking about specific parts of the program:
- Content Relevance: "How applicable was this material to your daily tasks?"
- Instructor Clarity: "On a scale of 1-10, how clear and engaging was the instructor?"
- Skill Confidence: "How confident do you feel applying these new skills on the job?"
Beyond surveys, you need structured knowledge checks and practical assessments. These are not just pass/fail tests; they measure real comprehension and the ability to apply what was learned. For instance, you could have a technician perform a simulated repair. This lets you assess their actual skill, not just their ability to memorize steps.
Gathering On-the-Job Performance Data
The real test of any training program occurs back in the workplace. This is where you shift from measuring what people learned to measuring what they do.
Structured observations are a powerful tool here. A manager or peer can use a simple checklist to see if an employee is consistently applying new safety protocols or using a new software feature correctly. It is direct, simple, and incredibly insightful.
Don’t stop at internal observations. If your training affects customer-facing roles, their feedback is invaluable. Integrating customer satisfaction scores or direct comments can provide undeniable proof of your training’s impact. Exploring different Ways to Collect Customer Feedback might uncover data sources you had not considered.
You also need to team up with other departments to obtain critical business data. Your Learning Management System (LMS) can automate tracking for completions and assessment scores, but the full story emerges when you pair that with data from other business systems.
Pull reports from:
- HR Systems: Track changes in employee retention or promotion rates for those who completed the training.
- CRM Data: Look for tangible increases in sales figures or faster customer ticket resolution times.
- Operational Reports: Monitor for a decrease in metrics like error rates, material waste, or machine downtime.
The future of data collection is even more precise. Modern learning technologies are a game-changer for obtaining objective measurements. When you explore how to use augmented reality for training, you will see how you can capture granular data on metrics like procedural accuracy, hesitation, and decision-making—details that are impossible to capture through traditional observation alone.
Analyzing Your Data and Calculating Training ROI

Gathering training data is one thing; turning it into a compelling story of impact is another. This is the moment you translate raw numbers and feedback into a powerful business case for your L&D initiatives. It's about moving beyond simple observation to prove your training delivers results.
The goal is to directly connect the dots between the behavioral changes you observed and the performance metrics you are tracking. Did the boost in skill confidence from post-training surveys actually lead to fewer support tickets? Did the improved procedural accuracy in assessments translate to a drop in production errors? Making these connections is what separates effective training from ineffective training.
From Correlation To Causation
Your mission is to demonstrate that the training—and not some other factor—was the driver of improvement. This can be challenging, but by combining different data points, you can build a much stronger case.
Imagine, for example, that you see a significant spike in sales performance, but only among the employees who took your training. If a control group’s performance remained flat during the same period, you have a clear indicator of your training's direct impact.
When you're diving into the numbers, a practical guide on how to analyze data in Excel can provide useful techniques for extracting these insights. You can often uncover powerful trends with fairly simple tools.
A crucial, and often overlooked, part of this analysis is assessing knowledge decay. It is human nature to forget things over time. By measuring how well skills are retained at 30, 60, and 90-day intervals, you can identify when reinforcement is needed and refine your follow-up strategy.
This is an area where immersive technology excels. Because virtual reality training solutions create memorable, hands-on experiences, they often lead to much higher long-term retention rates compared to passive learning methods.
The Ultimate Metric: Calculating Training ROI
While improved performance is fantastic, leadership almost always wants to discuss the bottom line. Calculating Return on Investment (ROI) is the definitive way to show financial value and secure your future L&D budget.
The basic formula is straightforward:
Training ROI (%) = [(Total Program Benefits – Total Program Costs) / Total Program Costs] x 100
Let’s apply this to a sales training scenario.
1. Tally Up the Total Program Costs
First, add up every expense. This includes development fees, instructor time, employee salaries for the hours spent in training, and any technology or material costs. Let's assume your grand total is $30,000.
2. Isolate and Monetize the Benefits
Next, pinpoint the financial gains that came directly from the training. Let's say your newly trained sales team increased their average deal size by $500, and they closed 200 deals in the six months following the program.
- Financial Benefit: 200 deals x $500 increase = $100,000 in new revenue.
3. Determine the Net Benefit
Now, subtract the costs from the benefits.
- Net Benefit: $100,000 – $30,000 = $70,000.
4. Calculate the Final ROI
Finally, plug those numbers into the ROI formula.
- ROI: ($70,000 / $30,000) x 100 = 233%
An ROI of 233% is significant. It means for every dollar the company invested in your training, it received $2.33 back in value. That is a language every executive understands.
When you can present a clear, data-backed ROI calculation, you instantly shift the conversation. L&D is no longer a cost center—it is a proven value driver for the entire business.
Leveraging XR Analytics for Deeper Performance Insights
Traditional methods of measuring training, such as surveys and quizzes, provide only a partial view. They can indicate if someone absorbed information, but they cannot prove that person can actually perform the skill when it matters.
This is where Extended Reality (XR)—which includes both Virtual Reality (VR) and Augmented Reality (AR)—fundamentally changes the process.
Immersive learning platforms move beyond theory. They capture objective, granular data on performance that was previously impossible to track. Instead of asking an employee if they feel confident, you can measure it directly through their actions. These powerful analytics provide undeniable proof of skill mastery, painting a much clearer picture of whether your training is effective.
Unlocking Granular Performance Data
Imagine a technician learning to repair a complex machine. In a traditional setting, you might observe them and take notes. But in a VR simulation, the system can automatically track every single movement with pinpoint precision.
It captures data points that reveal what is really happening:
- Procedural Accuracy: Did the trainee follow every step in the correct sequence, without shortcuts or deviations?
- Hesitation Metrics: How long did they pause before choosing the right tool or making a critical decision? These hesitations can indicate a lack of confidence or knowledge.
- Gaze and Attention Tracking: Where were they looking during the task? Were their eyes focused on the right components, or were they distracted and searching?
- Error Rates and Types: How many mistakes did they make? More importantly, were they minor procedural slips or critical safety errors?
This level of detail provides a massive advantage. It is objective, quantifiable proof that a learner not only knows what to do but can also execute the task efficiently and safely. This is the difference between certifying knowledge and verifying skill.
Practical Use Cases in Action
This rich data translates directly into better, more targeted training. For example, an AR-guided assembly task can flag an error in real-time, instantly correcting a worker’s mistake while logging it for later review. This data helps you identify common sticking points across the entire team, allowing you to fine-tune the training content to address those specific weaknesses.
Likewise, a VR simulation can measure a surgeon's precision down to the millimeter or an equipment operator's reaction time in a simulated emergency. The insights from these immersive sessions are invaluable.
To see how this technology is being implemented, you can explore the applications of modern VR training programs built around these data-driven principles. By integrating XR, you are no longer just hoping the training works—you are measuring it with a degree of accuracy that builds a rock-solid case for its impact.
Of all the questions people ask, the most common one is, "How soon after training should we start measuring?" The truth is, there is no single answer. An effective measurement plan is layered.
You will want to get initial feedback—Level 1 (Reaction)—immediately with surveys while the experience is still fresh. For Level 2 (Learning), a knowledge check within a week is ideal to see what information has been retained.
However, the real impact emerges over time. To see if behaviors have truly changed (Level 3), you need to give people a chance to apply what they have learned. The sweet spot is typically 30 to 90 days post-training. As for the big-picture results, Level 4 (Results), that can take anywhere from three to six months, or even longer, before you see a clear, undeniable impact on your business KPIs.
What Is the Biggest Mistake to Avoid?
The most common mistake is stopping at Level 1. Many organizations distribute "happy sheets," see good scores, and consider the job done.
While it is good to know your team enjoyed the training, satisfaction does not prove that a skill was learned or that a new behavior was adopted on the job. A worthwhile measurement strategy must push beyond satisfaction to get to the heart of what matters: learning, application, and bottom-line business results.
A high score on a feedback form is positive, but it is not a business outcome. The real goal is to prove that the training directly led to improved performance.
How Can I Isolate Training's Impact?
This is a critical question. How do you prove your training caused the improvement, and not something else? The most reliable method is using a control group.
The concept is simple. You take a group of employees who did not receive the training and compare their performance metrics against the group that did. By tracking both over the same timeframe, you can filter out the noise from other business factors and confidently attribute the results to your program.
Ready to measure training effectiveness with actual proof? AIDAR Solutions uses immersive AR and VR analytics to give you objective, data-driven evidence of skill mastery. We help you move beyond theory and into verified performance. Discover our advanced training solutions.


Comment(01)