Mastering Operational Efficiency Metrics
Operational efficiency metrics are the key performance indicators (KPIs) that measure how effectively a business converts inputs—such as time, labor, and capital—into valuable outputs. They serve as the vital signs for your organization, providing a clear, data-driven assessment of the health and performance of your daily processes.
Understanding Your Operational Dashboard
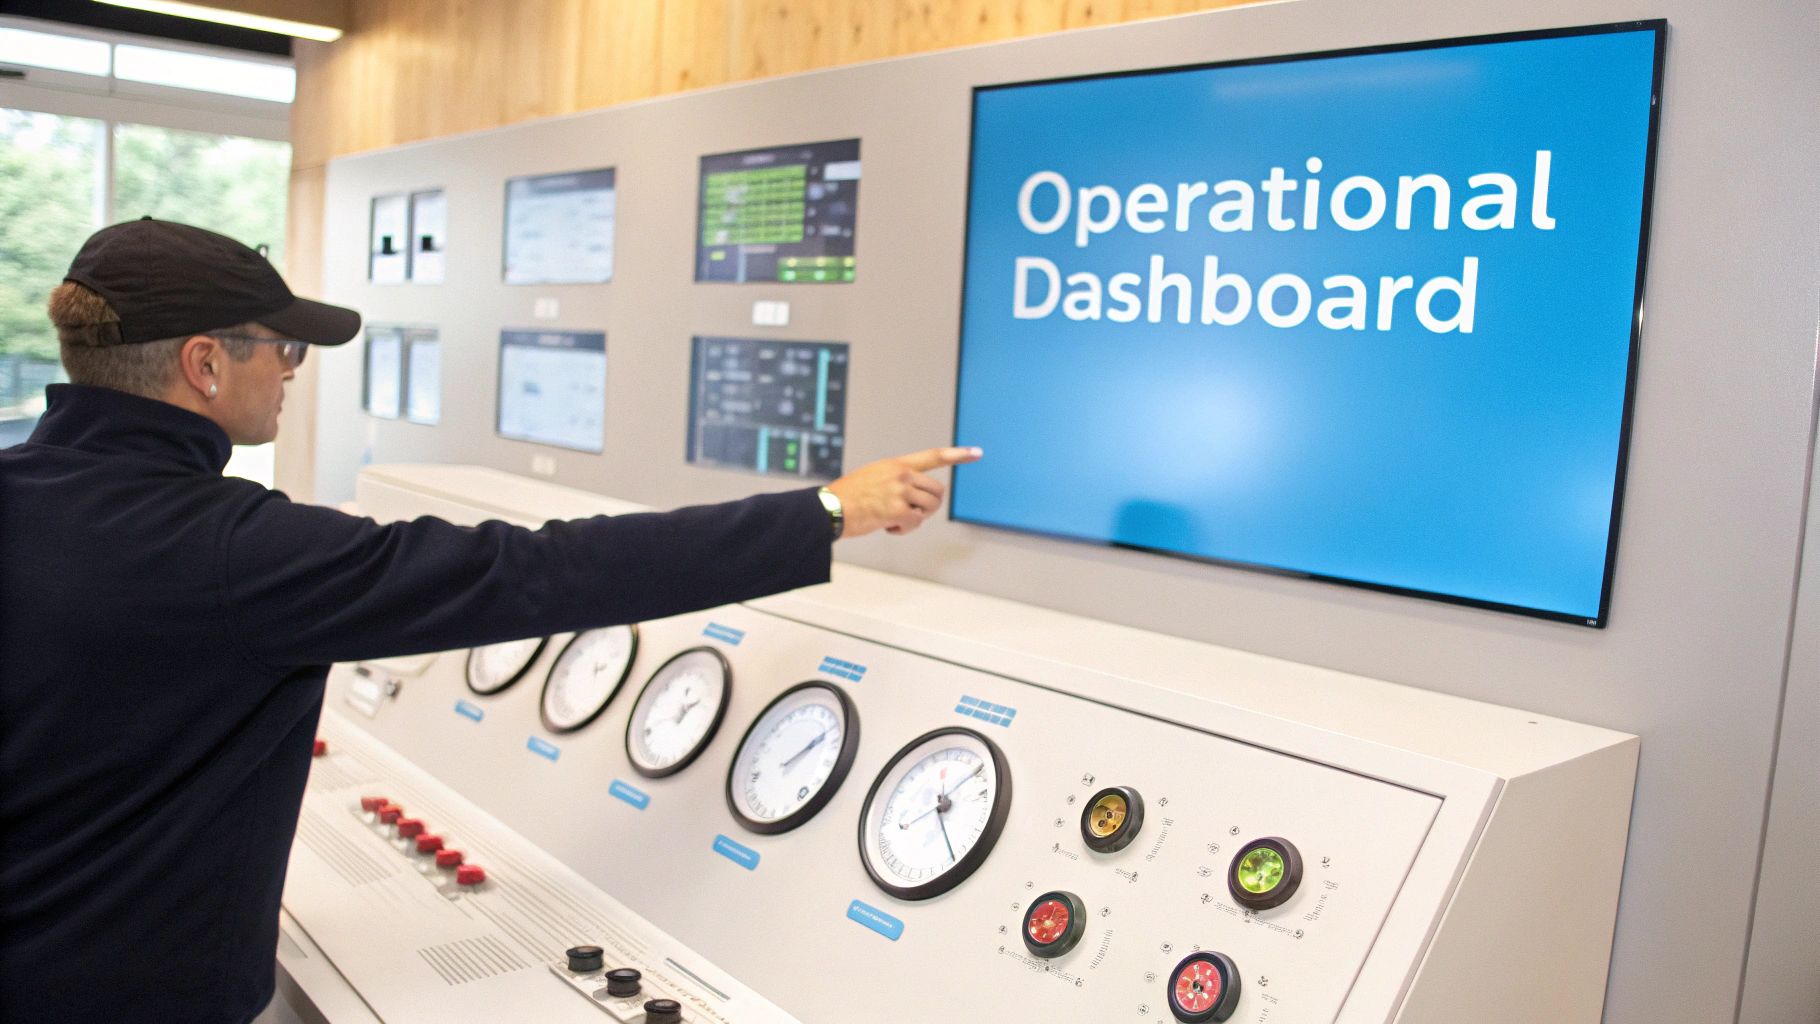
Consider your business a complex machine. To maintain optimal performance, you require a dashboard with precise gauges and indicators, not guesswork. Operational efficiency metrics are those gauges, providing the hard data needed to make informed, strategic decisions.
These metrics translate day-to-day activities into a universal language of performance. They quantify the cost of inefficient processes, illuminate opportunities for improvement, and validate the impact of strategic initiatives. By tracking the right metrics, you can pinpoint exactly where resources are being misallocated.
From Data Points to Strategic Decisions
A ship's navigator wouldn't chart a course across the ocean based on visual observation alone; they rely on instruments measuring speed, direction, and water depth. In the same way, operational metrics guide business strategy.
Metrics like cycle time or error rates are your navigational tools. They help you:
- Identify Bottlenecks: Instantly see where processes get stuck or break down, causing delays that impact your bottom line.
- Optimize Resource Allocation: Ensure your personnel, equipment, and materials are utilized to their full potential.
- Gain a Competitive Advantage: Deliver products and services faster, better, and more cost-effectively.
- Enhance Customer Satisfaction: Drive up quality and reliability, which fosters customer loyalty and repeat business.
This data-first mindset is the bedrock of a culture of continuous improvement. For a deeper analysis of this topic, this article explains the core concept of operational efficiency.
It boils down to this: operational efficiency isn't about working harder; it's about working smarter. The right metrics provide the roadmap to eliminate waste, streamline workflows, and build sustainable growth.
The Foundation for Growth and Savings
A firm grasp on these metrics is non-negotiable for financial health. They draw a direct line between operational activities and expenditures, exposing hidden inefficiencies that quietly drain your budget. When you know precisely how long a task should take or the optimal frequency for machine maintenance, you can implement targeted solutions that deliver measurable savings.
Understanding these numbers is the first step. Once you establish your baseline, you can set ambitious yet achievable goals and discover powerful ways for your company to reduce operational costs. This is how you build an organization that’s not just efficient, but resilient and prepared for future challenges.
Five Core Metrics to Drive Performance
In operations, it’s easy to become overwhelmed by data. While dozens of indicators can be tracked, true clarity comes from focusing on a handful of high-impact operational efficiency metrics. These act as your compass, cutting through the noise to show you exactly where to focus improvement efforts.
Think of these as the main gauges on your operational dashboard. Each one tells a vital story about the health of your processes, from machine performance to workforce skill. Mastering these five is the first step toward building a data-driven, resilient operation.
To help you get started, here’s a quick overview of the core metrics we’ll be breaking down.
Core Operational Efficiency Metrics at a Glance
| Metric | What It Measures | Simple Formula |
|---|---|---|
| Overall Equipment Effectiveness (OEE) | The percentage of manufacturing time that is truly productive. | Availability x Performance x Quality |
| Mean Time To Repair (MTTR) | The average time it takes to fix a failed asset and get it working again. | Total Downtime / Number of Failures |
| First-Time Fix Rate (FTFR) | The percentage of service calls resolved on the first visit. | (Fixes on First Visit / Total Calls) x 100 |
| Time-to-Proficiency | How long it takes a new employee to reach a competent performance level. | Time from Start Date to Competency Milestone |
| Error Rate | The percentage of outputs that don't meet quality standards. | (Number of Errors / Total Outputs) x 100 |
Each of these metrics provides a unique window into your operations. Let's dive deeper into what they really mean.
Overall Equipment Effectiveness (OEE)
Often considered the gold standard for manufacturing productivity, Overall Equipment Effectiveness (OEE) provides a clear measure of performance. It reveals what percentage of your manufacturing time is actually productive. A perfect 100% OEE score signifies that you are producing only quality parts, at maximum speed, with zero downtime.
What makes OEE so powerful is that it bundles three critical factors into one score:
- Availability: This tracks any planned or unplanned stop that brings production to a halt, such as equipment failures or lengthy changeovers.
- Performance: This accounts for anything that slows production from its maximum speed—such as micro-stops or running at a reduced rate.
- Quality: This measures defective parts, including those that require rework. The goal is always to get it right the first time.
The formula is a clean multiplication: OEE = Availability x Performance x Quality. While a world-class score is approximately 85%, many companies discover their operational performance is much lower, presenting a significant opportunity for improvement.
Mean Time To Repair (MTTR)
When a critical machine fails, every second of downtime impacts revenue. Mean Time To Repair (MTTR) measures the average time required to resolve a failure and return the asset to service. It is a direct reflection of the efficiency and responsiveness of your maintenance team.
A low MTTR indicates a well-organized maintenance operation. It means your technicians can diagnose problems quickly, access the right parts, and execute repairs efficiently. A high MTTR, conversely, often points to systemic issues: inadequate training, inaccessible technical manuals, or disorganized spare parts inventory. Reducing this number is one of the fastest ways to minimize costly downtime. To get ahead of failures, our guide on condition monitoring and predictive maintenance is a valuable resource.
MTTR isn't just a maintenance metric; it's a business continuity metric. It quantifies your organization's ability to recover from disruption and get back to creating value.
First-Time Fix Rate (FTFR)
Few things are more inefficient than a technician needing to make a return visit for the same issue. The First-Time Fix Rate (FTFR) tracks the percentage of service calls that are completely resolved on the first attempt, with no follow-ups required.
For any service organization, this metric is critical. A high FTFR is directly tied to:
- Increased Customer Satisfaction: Customers value a swift and definitive resolution to their problems.
- Reduced Operational Costs: Fewer truck rolls mean lower fuel, labor, and travel expenses.
- Improved Technician Productivity: When a job is done right the first time, technicians can move on to the next call, increasing the number of service requests handled per day.
Calculating it is straightforward: FTFR = (Number of Fixes Completed on First Visit / Total Number of Service Calls) x 100. A strong FTFR is evidence of excellent training, accurate diagnostics, and well-stocked service vehicles.
Time-to-Proficiency
Hiring a new employee is just the beginning. The real challenge is onboarding them to a point where they can contribute effectively and independently. Time-to-Proficiency measures exactly that—how long it takes for a new hire to reach a competent level of performance. This metric focuses on real-world competence rather than theoretical knowledge.
This metric reveals a great deal about the effectiveness of your onboarding and training programs. A short time-to-proficiency means new employees add value sooner, reducing the burden on senior staff and boosting overall team productivity. A prolonged timeline often signals unstructured training, weak mentorship, or difficult-to-access documentation.
Error Rate
Finally, the Error Rate serves as a universal quality-control gauge. It measures the percentage of outputs that fail to meet established standards. This could apply to defective products on an assembly line, incorrect shipments, or simple data entry mistakes.
The formula is as simple as it gets: Error Rate = (Number of Errors / Total Number of Outputs) x 100. While the ultimate goal is zero defects, tracking this number helps identify systemic process flaws or training gaps. A rising error rate is an early warning that a small problem may escalate if not addressed.
Building Your Measurement and Tracking System
Defining your operational efficiency metrics is a crucial first step, but metrics on paper do not drive improvement. To make them actionable, you need a reliable system for measurement and tracking. Without a solid tracking system, you are navigating with a map but no compass. This infrastructure transforms a flood of raw data into the clear signals needed for smart, proactive decision-making.
The heart of any good tracking system is its data pipeline, which pulls information from every corner of your organization.
- Sensors and IoT Devices: These are your eyes and ears on the factory floor, providing real-time data from equipment—from machine uptime to production speed.
- ERP and CRM Systems: These systems contain valuable information on orders, inventory levels, customer interactions, and service dispatches.
- Manual Logs and Reports: Never underestimate the value of human input. A technician's notes or a quality control checklist often hold critical context that automated systems cannot capture.
The key is to consolidate this information into a single source of truth, such as a data warehouse. This step is non-negotiable. It breaks down data silos and ensures everyone—from the shop floor to the C-suite—is working from the same playbook.
From Raw Numbers to Actionable Insights
Once your data is centralized, it must be translated into an understandable format. A spreadsheet of raw numbers rarely inspires action. This is where data visualization tools like Tableau or Power BI come in, transforming complex datasets into intuitive, real-time dashboards. A well-designed dashboard doesn't just display numbers; it tells a story about what’s happening in your operations.
The infographic below shows how core metrics like OEE, MTTR, and Error Rate are not just isolated figures—they all contribute to the central goal of performance.
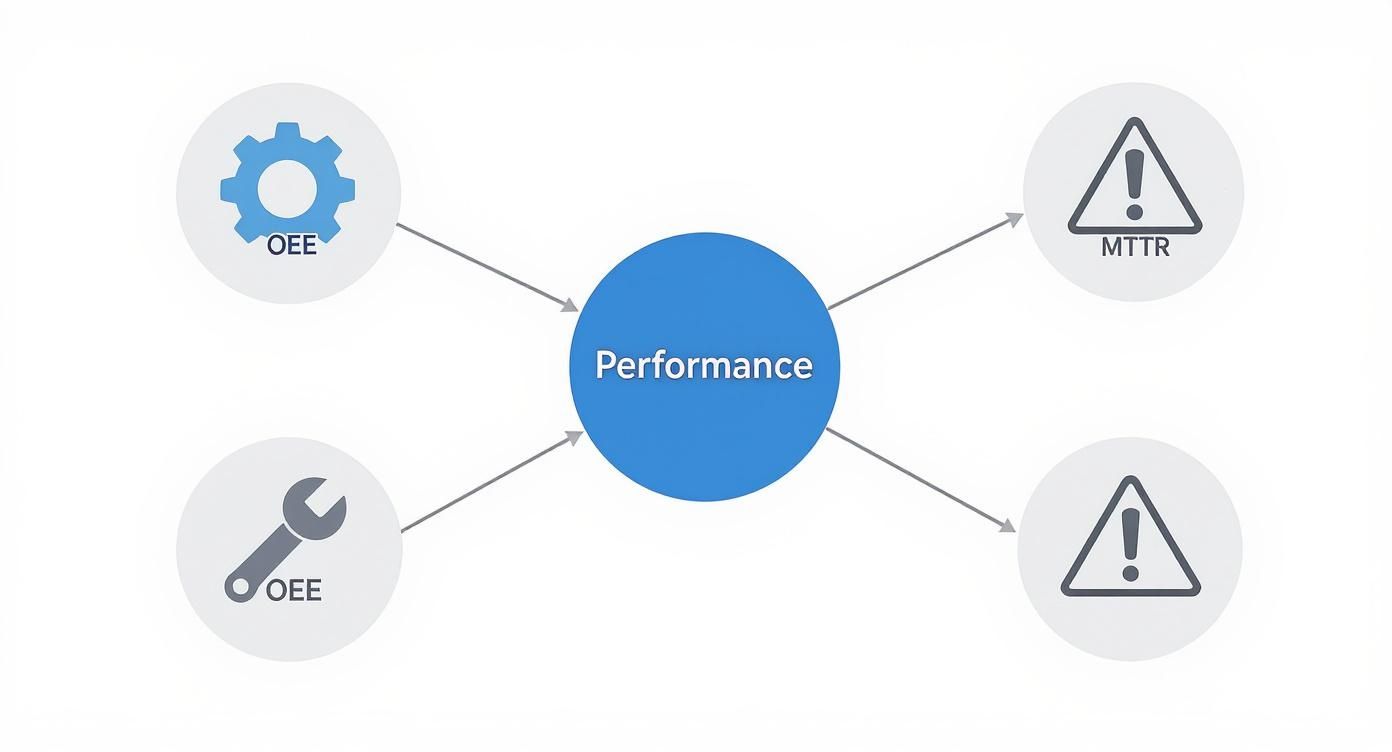
As you can see, these metrics are interconnected parts of a larger performance engine. When you improve one, such as reducing MTTR, it creates a positive ripple effect that boosts overall effectiveness.
By putting business intelligence tools to work, companies are unlocking significant gains. Some studies show a 25% improvement in operational efficiency and a 15% reduction in operational costs. Moreover, data-driven organizations were found to be 30% more profitable than their competitors.
Establishing Strong Data Governance
Finally, a tracking system is only as good as the data flowing through it. That’s where data governance comes in. It is the set of processes and standards that ensures your information is accurate, consistent, and secure—essentially, quality control for your data.
Data governance is what gives you the confidence to look at your MTTR dashboard and trust that the number you see is a true reflection of reality. It builds faith in the metrics and fosters a culture where decisions are made on facts, not gut feelings.
This framework is a cornerstone of any successful digital transformation. A solid measurement system provides the feedback loop needed to determine if strategic initiatives are succeeding or if a pivot is required. To see how this fits into the bigger picture, you can explore our detailed digital transformation strategy framework.
Building this system might sound like a massive undertaking, but the secret is to start small. Focus on one or two critical metrics, perfect the process, and then scale your efforts across the rest of the organization.
How AR and VR Solutions Drive Real-World Results

Knowing your metrics is one thing; improving them requires a different class of tools. This is where Augmented Reality (AR) and Virtual Reality (VR) transition from emerging technologies to practical solutions. These technologies are powerful engines for optimizing the very metrics that define operational success.
By overlaying digital guidance onto the physical world or creating risk-free training simulations, AR and VR directly address the root causes of inefficiency. They empower your team with immediate access to knowledge, reduce human error, and accelerate learning in ways traditional methods cannot match. Let's examine the practical applications.
Reduce Downtime with AR-Powered Remote Support
When critical equipment fails, your Mean Time To Repair (MTTR) becomes the paramount metric. Every second of downtime translates to lost revenue. The traditional approach—flying in a senior expert—often results in days of waiting and significant travel expenses.
AR remote assistance tools offer a clear advantage. A junior technician on-site can wear smart glasses and stream their exact point-of-view to an expert located anywhere in the world. The expert sees what the technician sees and can guide the entire repair process in real-time.
This is more than a simple video call. The expert can:
- Annotate the physical environment: They can circle the correct component, draw arrows to indicate direction, and display schematics directly in the technician's field of view.
- Share documents instantly: The expert can send the correct diagram or work order straight to the AR display, eliminating the need to consult a separate laptop or paper manuals.
- Provide step-by-step guidance: They can walk the on-site technician through the entire repair, ensuring it is performed correctly and safely the first time.
Providing frontline workers with immediate access to expert guidance is a game-changer. Companies using this approach have reduced service times and slashed expert travel costs by up to 75%. This directly reduces MTTR and significantly improves the First-Time Fix Rate (FTFR).
Accelerate Skill Development and Reduce Errors with VR Training
Onboarding new hires can be a significant operational drag. Your Time-to-Proficiency metric reflects this, and a long ramp-up period consumes resources. Furthermore, a high Error Rate among new staff leads to wasted materials, costly rework, and potential safety risks.
Immersive VR training provides a powerful solution. A new employee can practice complex, multi-step procedures on a perfect virtual replica of your equipment. This creates a completely safe environment where they can make mistakes, learn from them, and repeat the process until it becomes second nature—all without using live machinery or disrupting production.
The benefits for your core operational efficiency metrics are substantial:
- Reduces Time-to-Proficiency: Studies indicate that learners in VR can achieve full competency up to four times faster than those in traditional classroom settings.
- Dramatically lowers Error Rates: When an employee builds muscle memory in a virtual environment, they are more confident and less likely to make mistakes on the actual factory floor.
- Improves Safety and Retention: Well-trained, confident employees are safer and more satisfied in their roles, which positively impacts both safety records and employee turnover.
The push for better efficiency is universal. The PwC Digital Trends in Operations Survey of 610 executives found that 93% of companies see it as a key priority, and 62% believe AI and automation are highly effective for creating value. You can dive deeper into these insights from the PwC digital supply chain survey.
Unlocking a New Level of Performance
Integrating AR and VR into your operations is a strategic move to empower your people and fortify your processes. When you provide teams with tools that make them faster, more accurate, and safer, you create a direct, positive impact on the operational efficiency metrics that drive profitability. The result is a more resilient and productive operation.
To learn more about putting these strategies into action, check out our guide on how to improve manufacturing efficiency.
Your Strategic Action Plan for Improvement
Translating data into meaningful action is where the real work begins. A dashboard of metrics is only a diagnostic tool until you have a clear plan to improve those numbers. This isn't about random fixes; it's about building a strategic process that shifts you from reactive problem-solving to proactive, data-backed improvements.
The process starts with focus. You cannot fix everything at once. Select one or two "North Star" metrics that are directly tied to your most critical business goals. For example, if reducing customer churn is your top priority, your North Star metric should be First-Time Fix Rate (FTFR).
Establish Your Performance Baseline
Before charting a course for improvement, you must know your current position. This requires digging into the data to establish an accurate, honest baseline for your North Star metric. Rely on historical data from the last several months to get a clear view of actual performance, rather than relying on assumptions.
This baseline is your starting line. It grounds everything in reality and becomes the yardstick against which all progress is measured. You might find, for instance, that your current FTFR is 68%. You now have a concrete number to address.
Set Ambitious Yet Achievable Targets
With a baseline in hand, it's time to set a goal. The goal should be specific, measurable, achievable, relevant, and time-bound (SMART). A good target should be challenging enough to motivate the team but not so ambitious that it leads to frustration.
Here’s what that looks like in practice:
- Baseline: Our current FTFR is 68%.
- Target: Increase FTFR to 75% within the next six months.
- Action: The team now has a clear, time-sensitive objective to rally around.
This kind of structured goal-setting differentiates strategic planning from wishful thinking. For more actionable strategies, guides on how to improve operational efficiency can offer a deeper dive. This approach turns a vague idea into a defined mission.
Identify Root Causes and Pilot New Solutions
You have a target. Now, determine why your FTFR is at 68%. Perhaps field technicians lack immediate access to the correct schematics, or they encounter complex problems requiring an expert who isn't on-site. This is the ideal time to evaluate new tools that can address these specific bottlenecks.
Instead of a massive, risky overhaul, launch a targeted pilot program. You could equip one team or technicians servicing a specific machine with an AR remote assistance tool. This allows you to test the solution in a controlled manner, gather hard data on its impact, and build a solid business case before considering a company-wide rollout.
A successful pilot does more than just prove a tool works. It builds momentum. It creates internal champions who will help you drive wider adoption and a genuine shift in how things get done.
This strategy—pinpoint, test, and prove—is a core principle of boosting productivity. In fact, a report from AssessTEAM found that organizations with solid employee evaluation systems can increase productivity by up to 20% simply by identifying these kinds of bottlenecks and aligning everyone's goals.
Foster a Culture of Continuous Improvement
Finally, remember that operational excellence is not a project with an end date; it is a permanent cultural shift. Your goal is to create a continuous feedback loop where data from your operational efficiency metrics consistently informs your decisions.
Celebrate wins. When objectives are not met, analyze what happened without assigning blame. Make data a standard part of every team meeting.
When your team sees a direct line between their daily work and the key metrics on the dashboard, they become more engaged, more proactive, and more likely to find creative solutions on their own. This is how your organization stops just improving and starts evolving—ready to adapt and succeed, no matter what changes lie ahead.
Frequently Asked Questions
When you start digging into operational efficiency, a few questions always seem to pop up. Let's tackle them head-on. Getting these concepts straight is the first step to building a measurement strategy that actually works.
What's the Real Difference Between Operational Efficiency and Productivity?
It’s easy to use these terms interchangeably, but they're pointing at two very different things. Think of it this way: Productivity is pure output. It’s about how much you get done in a set amount of time—how many widgets your line produces per hour, for instance. It's a numbers game focused on quantity and speed.
Operational efficiency, however, is about the quality of that process. It's obsessed with rooting out and eliminating waste—wasted time, wasted materials, wasted effort. You could be incredibly productive, hitting record numbers, but if half your output has defects or you’re burning through raw materials to do it, you aren't efficient.
Ultimately, getting more efficient almost always makes you more productive. But cranking up the speed doesn't guarantee you're working smarter. Efficiency is about doing things the right way, not just the fast way.
How Do I Pick the Right Metrics for My Business?
The sheer number of metrics out there can feel overwhelming. The secret is to stop thinking about tracking everything and start thinking about your core business goals. Trying to measure it all at once is a classic mistake that just leads to data paralysis.
Instead, take a more focused approach:
- Pinpoint Your Top Priority: What's the one thing that matters most to your business right now? Is it slashing operational costs? Making customers happier? Gaining ground on a competitor?
- Match Metrics to the Mission: Now, pick 3-5 operational efficiency metrics that directly measure progress toward that goal. If customer loyalty is the name of the game, First-Time Fix Rate (FTFR) is your hero metric. If manufacturing costs are keeping you up at night, Overall Equipment Effectiveness (OEE) is where you should live.
- Start Small, Then Grow: Get really good at tracking and improving those few core metrics. Once your team gets the hang of it and starts seeing tangible wins, you can begin to add other relevant indicators to your dashboard.
What’s the First Step to Implementing AR or VR?
Jumping headfirst into AR or VR without a clear problem to solve is a recipe for a costly experiment with no clear ROI. The best way to start isn't with a massive, company-wide rollout; it's with a small, focused pilot program that targets a specific pain point.
The most successful implementations always start by identifying your single biggest operational headache. A well-defined problem is the perfect proving ground to show undeniable, measurable value and build a rock-solid business case.
For example, is one particular machine always going down, killing your Mean Time To Repair (MTTR)? Are new technicians making the same costly mistakes over and over, driving up your Error Rate? Find the problem that’s causing the most damage to your bottom line.
Then, launch a targeted pilot. Use a tool like AR remote assistance for that one problematic machine. The data from a successful pilot—slashed downtime, reduced errors, faster fixes—will speak for itself. It creates internal champions and gives you the momentum you need for a broader, more strategic implementation.
Ready to see how immersive technology can move the needle on your key operational efficiency metrics? At AIDAR Solutions, we build AR and VR tools designed to deliver measurable results—from crushing downtime with remote assistance to accelerating skills with zero-risk virtual training. Explore our solutions today and start building a more resilient, data-driven operation.

