How to Calculate Return on Investment for AR/VR
At its core, calculating return on investment is a straightforward financial exercise: take the net gain from an investment, divide it by the original cost, and multiply by 100.
The classic formula, (Gain – Cost) / Cost, produces a percentage that provides a clear, objective measure of an investment's profitability.
Why Return on Investment Matters

Before building a business case for a new technology, it's essential to understand Return on Investment (ROI). It’s not just another business metric; it's the universal language for measuring value and efficiency in a business context.
For any project—especially a complex technology deployment—ROI is the ultimate scorecard. It directly answers the one question every stakeholder will ask: "Was the investment worthwhile?"
This calculation provides a standardized way to evaluate different opportunities. For example, should the company invest in new machinery for the factory floor or a software solution for its field service team? ROI cuts through subjective opinions and provides a common ground for making objective, data-driven decisions.
Quantifying the Full Value
Calculating ROI is more than just plugging numbers into a formula. It’s about deeply understanding what a "return" actually looks like. This is particularly true when evaluating a system like XR, where the benefits go far beyond simple cost savings. If you want to dive deeper, you can learn more about what XR technology is in our comprehensive guide.
Returns generally fall into two categories:
- Tangible Gains: These are the benefits you can easily quantify. Think direct cost savings from reduced travel, productivity increases from faster job completion, or lower material waste during training simulations.
- Intangible Benefits: These are the gains that are harder to assign a specific dollar value to but are just as crucial. This includes improved employee safety from virtual training, higher morale from better tools, and an enhanced brand reputation due to superior service.
A solid ROI analysis doesn't just list these benefits; it translates them into a compelling financial narrative. The goal isn't just to justify an expense, but to demonstrate how an investment creates lasting business value.
The basic ROI formula has been a business standard for a century, used to compare major capital projects. For leaders looking at solutions like AIDAR’s XR platforms today, that same trusted formula can be applied to very specific outcomes—like monetizing a 50% reduction in service time or a 75% cut in expert travel.
By building your case on this solid, business-focused foundation, you can confidently showcase the full, game-changing value of an AR/VR investment.
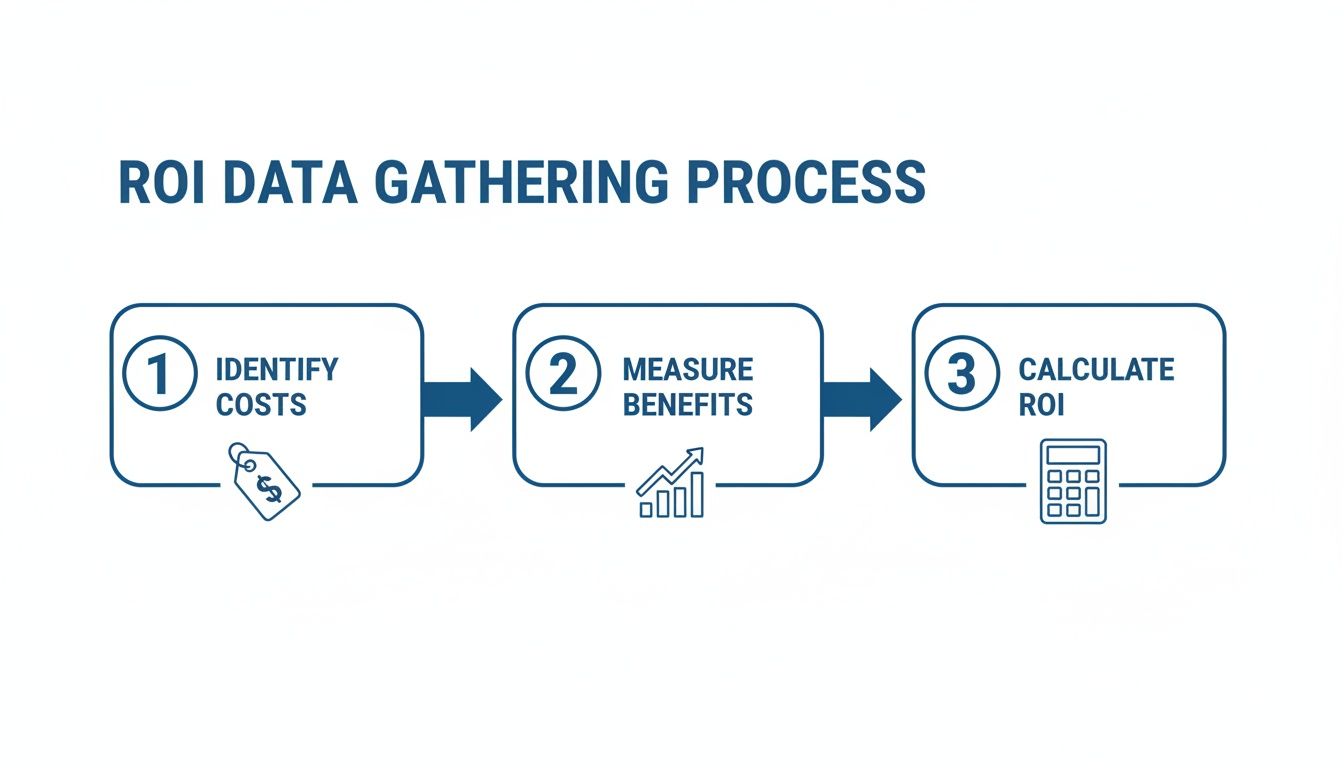
Gathering the Right Data for Your Analysis
An ROI calculation is only as credible as the data it's based on. Before using any formula, it is critical to build a foundation of accurate figures that capture the true costs and real-world benefits of an XR deployment.
The integrity of the entire analysis depends on the quality of the initial data.
First, you must meticulously identify and categorize every investment cost. This goes beyond the price of headsets and software. A thorough cost analysis prevents unforeseen expenses and ensures your final ROI figure is defensible and reliable.
Pinpointing Your Investment Costs
Generally, costs fall into two categories: one-time capital expenditures and recurring operational expenses. It's crucial to separate these to get a clear picture of both the initial financial outlay and the ongoing commitment.
Start by listing your capital expenditures (CapEx). These are the upfront costs to get the project operational.
- Hardware: This includes all physical equipment—AR/VR headsets, tablets, and any necessary servers or computing infrastructure.
- Initial Software Licenses: This covers perpetual licenses or the first-year subscription for platforms like AIDAR.SKILLS or AIDAR.SERVICE.
- Implementation and Setup: Include fees for professional services, system integration, and initial configuration.
- Initial Employee Training: Account for the cost of bringing the team up to speed with the new technology.
Next are the operational expenditures (OpEx), which are the ongoing costs required to maintain the system. These recurring costs are just as important as the initial spend.
A common oversight is focusing only on the initial purchase price. Forgetting to factor in recurring costs like software subscriptions, support contracts, and ongoing training can dramatically skew an ROI calculation, making an investment appear more profitable than it truly is.
Quantifying the Gains and Benefits
With your costs tallied, the next step is to translate operational improvements into financial figures. This is where you connect the technology to tangible business outcomes. The goal is to move from general observations like "things seem faster" to precise, quantifiable metrics.
On the benefits side, look for direct financial gains and operational efficiencies. These are the "returns" in your calculation.
- Reduced Error Rates: If AR-guided assistance cuts assembly errors by 15%, you can calculate the exact cost of scrap and rework you are now saving each month.
- Faster Onboarding: If virtual training with AIDAR.SKILLS slashes the time-to-competency for new hires from six weeks to three, you can put a real dollar value on that accelerated productivity. Our guide on how to measure training effectiveness dives deeper into this.
- Decreased Machine Downtime: By using remote assistance to resolve equipment issues in minutes instead of hours, you can calculate the significant value of that recovered production time.
- Eliminated Travel Costs: Tally the savings from flights, hotels, and per diems by replacing in-person expert visits with remote support sessions.
To do this effectively, you need solid financial data. Getting comfortable with financial statements is essential for sourcing the right inputs. Understanding key financial statements like the P&L and Balance Sheet will help you confidently pull the right numbers for metrics like operational costs and asset values. By diligently gathering and categorizing these data points, you build a comprehensive and believable financial picture—the foundation for a rock-solid analysis.
Mastering the Core ROI Calculation Formulas
You've done the hard work of gathering your cost and benefit data. Now it's time to turn those raw numbers into a story that proves the value of your AR/VR investment. This is where we craft a compelling financial narrative.
While the basic ROI formula is a great starting point, a truly solid business case examines the project's financial health from several different angles.
Each step of the analysis builds on the one before it. A meaningful calculation is impossible without a solid understanding of your costs and benefits.
The Foundational ROI Percentage
The quickest and most direct way to answer "what's the return?" is with the standard ROI percentage. It’s a universally understood metric, offering an immediate, high-level snapshot of profitability.
The formula is:
ROI (%) = [(Net Profit from Investment – Cost of Investment) / Cost of Investment] x 100
Let’s apply this to a real-world context. Imagine a manufacturing plant invests $150,000 in an AR solution like AIDAR.SERVICE to reduce equipment downtime.
- Cost of Investment: $150,000 (covering hardware, software licenses, and implementation).
- Net Profit: In the first year, they calculated that reduced downtime and eliminating expert travel saved them $225,000 in operational costs.
Plugging this into the formula, we get:
ROI = [($225,000 – $150,000) / $150,000] x 100 = 50%
That 50% ROI is a powerful number to present to any stakeholder. It means for every dollar invested, the company got that dollar back plus an additional 50 cents. If you want to model your own scenarios, our interactive training ROI calculator is a useful tool.
Calculating the Payback Period
A high ROI percentage is great, but the next question from leadership is often, "How long until we see our money back?" That’s where the Payback Period comes in. It pinpoints the time it takes for returns to cover the initial investment.
Here's the formula:
Payback Period = Initial Investment / Annual Cash Flow
Sticking with our manufacturing example, the plant spent $150,000 and generated $225,000 in savings (annual cash flow) in year one.
Payback Period = $150,000 / $225,000 = 0.67 years
To make that number more tangible, convert it to months: 0.67 x 12 = 8 months. A payback period of just eight months signals a low-risk, fast-returning project that executives favor.
To help you decide which metric to use, here’s a quick comparison of the most common financial tools for evaluating technology investments.
ROI Metrics at a Glance
| Metric | Formula | What It Measures | Best Used For |
|---|---|---|---|
| ROI Percentage | [(Net Profit – Cost) / Cost] x 100 | The overall profitability of an investment as a percentage. | Quick, high-level assessment of return and comparing different projects. |
| Payback Period | Initial Investment / Annual Cash Flow | The time it takes to recoup the initial investment. | Assessing risk and understanding how quickly capital will be freed up. |
| Net Present Value (NPV) | Σ [Cash Flow / (1 + r)^t] – Initial Investment | The total value of a project in today's money, considering inflation. | Long-term projects where the timing of cash flows is critical. |
| Internal Rate of Return (IRR) | The discount rate where NPV = 0 | The annualized rate of return an investment is expected to generate. | Comparing projects with different scales and lifespans against a company hurdle rate. |
Each metric provides a different piece of the puzzle. Using them together creates a richer, more defensible business case than relying on a single metric.
Understanding Net Present Value (NPV)
The Payback Period is great for its simplicity, but it has one major limitation: it treats all money the same, whether received today or five years from now. Net Present Value (NPV) addresses this by accounting for the time value of money—the principle that a dollar today is worth more than a dollar tomorrow.
NPV calculates the current value of all future cash flows from a project, then subtracts the initial investment. A positive result indicates the project is expected to generate more value than it costs.
NPV is the gold standard for evaluating long-term projects. It forces you to consider inflation and opportunity cost, providing a more realistic view of a project's true profitability over its entire lifecycle.
The formula can appear complex but is easily handled by spreadsheet software:
NPV = Σ [Cash Flow / (1 + r)^t] – Initial Investment
Where:
- r = discount rate (your company's required rate of return)
- t = time period (year 1, year 2, etc.)
A positive NPV is a green light. It proves the investment not only meets but exceeds the company's minimum financial requirements.
Finding the Internal Rate of Return (IRR)
Last is the Internal Rate of Return (IRR). Think of IRR as the project's own internal interest rate. Technically, it's the discount rate that makes the NPV of all cash flows equal zero.
In practical terms, if a project's IRR is 15%, it means the investment is forecast to generate a 15% annual return. You then compare that figure to your company's "hurdle rate"—the minimum acceptable rate of return for any new project.
- If IRR > Hurdle Rate: The project is financially viable.
- If IRR < Hurdle Rate: The project should be rejected or re-evaluated.
Calculating IRR manually is difficult, but spreadsheet programs like Excel (=IRR() function) do it instantly. It provides a single percentage that is easy to compare across different investment opportunities, making it a favorite tool for capital budgeting. To see more detailed examples, it's worth checking out guides on how to calculate return on investment for automation projects, as many of the principles directly apply to XR deployments.
Building a Compelling AR/VR Business Case
The formulas provide the financial proof, but real-world examples are what make a business case compelling. It’s one thing to present a spreadsheet; it's another to tell a story that connects an AR/VR investment directly to the operational challenges your leadership team is trying to solve.
This is where you shift the conversation from a dry calculation into a powerful argument for change. Let's walk through two detailed ROI models for common industrial applications. These examples will show you exactly how to frame your analysis, quantify the returns, and build a narrative that gets approval.
Manufacturing Training with AIDAR.SKILLS
Consider a mid-sized manufacturer dealing with high turnover on the assembly line. New hires take an average of six weeks to become fully proficient, and that ramp-up period is marked by wasted materials and minor safety incidents. They decide to model the ROI of implementing an AR-powered training solution like AIDAR.SKILLS.
First, tally up the total investment for a one-year pilot program for 50 new hires.
- Software Licensing: $30,000 for the AIDAR.SKILLS platform.
- Hardware: $20,000 for 10 AR headsets to be shared among trainees.
- Implementation & Content Creation: $15,000 for the initial setup and building specific training modules.
This brings the Total Investment Cost to $65,000.
Now, quantify the payback based on their historical data.
-
Faster Time-to-Productivity: AR training reduces the ramp-up time from six weeks to just three. With a burdened labor cost of $25/hour, every week a new hire isn't fully productive costs $1,000. Saving three weeks for each of the 50 new employees results in a $150,000 gain.
-
Less Material Waste: New trainees previously scrapped about $400 in materials each. The AR simulations cut this waste by 75%, saving $300 per trainee. Across 50 people, that’s another $15,000 saved.
-
Fewer Safety Incidents: The company was averaging five minor incidents a year during training, each costing around $2,000 in paused production and administrative work. The immersive training is projected to eliminate 80% of these, saving $8,000.
So, the Total Gain from Investment is $173,000 ($150,000 + $15,000 + $8,000).
Now, plug it into the basic ROI formula:
ROI = [($173,000 – $65,000) / $65,000] x 100 = 166%
A 166% ROI in the first year is a headline that grabs attention. It tells stakeholders that for every dollar they put into AR training, they’ll get that dollar back plus an extra $1.66 in measurable savings. That is the kind of clear, impactful result that drives positive decisions.
Field Service with AR-Powered Remote Support
Next, consider a field service organization with 20 technicians. Their biggest challenges are flying senior experts to job sites, a low first-time fix rate (65%), and costly customer downtime that triggers contract penalties. They’re looking at an AR remote assistance tool like AIDAR.SERVICE to improve performance.
Let's break down their investment for year one.
- Software Licensing: $24,000 for 20 technician licenses.
- Hardware: $10,000 for a mix of AR-compatible smart glasses and tablets.
- Initial Training: $6,000 to get the team proficient with the new tools.
The Total Investment Cost is $40,000.
With the investment locked in, we can start calculating the returns.
-
Eliminated Travel Costs: They previously flew a senior expert to complex jobs 25 times a year, at an average cost of $2,500 per trip. AR remote support will eliminate 90% of these trips. That's an immediate, direct saving of $56,250.
-
Improved First-Time Fix Rate (FTFR): With an expert virtually assisting, the FTFR jumps from 65% to 85%. This 20% boost means avoiding 50 expensive second visits annually. At an average cost of $1,200 per truck roll (labor, fuel, parts), this saves another $60,000.
-
Reduced Customer Downtime Penalties: By fixing issues faster and on the first try, the company projects it will avoid $30,000 a year in service-level agreement (SLA) penalties.
The Total Gain from Investment comes to $146,250 ($56,250 + $60,000 + $30,000).
Time to calculate the final ROI percentage:
ROI = [($146,250 – $40,000) / $40,000] x 100 = 266%
A 266% ROI is an incredibly strong financial argument. These examples show how to calculate return on investment by tying the technology directly to the numbers that matter.
For a deeper dive into these applications, you can learn more about the strategic impact of augmented reality in business and see how it’s creating value across different industries. When you build your case around tangible, real-world scenarios like these, you elevate the conversation from cost to value creation.
Avoiding Common Pitfalls in Your ROI Calculation
A solid ROI analysis is more than just accurate math. It's about avoiding the common traps that can undermine your business case. Knowing how to calculate ROI correctly means being aware of these pitfalls, as they can lead to skewed results and a loss of credibility with leadership.
Even the most promising XR projects can be rejected if stakeholders find holes in the numbers. Let's walk through the most frequent mistakes and how to keep your own calculations airtight, defensible, and persuasive.
Forgetting the Total Cost of Ownership
This is a classic and damaging mistake: underestimating the true cost of the proposed project. It’s easy to focus on the big-ticket items—the headsets, the initial software licenses—and stop there. But those are just the tip of the iceberg. The Total Cost of Ownership (TCO) covers every expense over the project's entire lifecycle.
If you ignore these "hidden" costs, your ROI will be artificially high, setting the project up for budget overruns.
To get it right, your cost analysis must include:
- Ongoing Training: Your team will require more than a single training session. You must budget for training new hires and conducting refresher courses for existing staff.
- IT Support and Maintenance: Factor in software updates, potential hardware repairs, and the hours your IT team will spend supporting the new technology.
- Content Updates: For a training platform like AIDAR.SKILLS, procedures and best practices evolve. Account for the time and resources required to keep virtual training modules current.
A business case built on an incomplete cost picture is fundamentally flawed. Before calculating the "return" side of the equation, you need an exhaustive and honest accounting of every dollar you plan to invest.
Overstating Benefits with Unrealistic Assumptions
Just as dangerous as underestimating costs is overinflating the benefits. It’s tempting to paint the rosiest picture possible, but your projections must be anchored in reality. An ROI figure that seems too good to be true will raise red flags for any experienced executive.
Every benefit you claim needs a clear, logical assumption behind it. For instance, if you project a 20% reduction in machine downtime, be prepared to explain how the AR solution achieves that. Is it through faster diagnostics with AIDAR.SERVICE? Quicker access to schematics? Immediate expert guidance?
The key is to be conservative and transparent. Use your own historical data whenever possible, and clearly state every assumption you've made. This demonstrates due diligence and makes your final numbers far more believable.
Failing to Establish a Clear Baseline
You cannot measure improvement if you do not know your starting point. Without a solid, data-backed baseline of your current performance, any claims of improvement are merely speculation. Before you calculate the "gain from investment," you must quantify the "pain" of your current process.
This means documenting key metrics before the project begins:
- What is your average first-time fix rate right now?
- How much are you actually spending on expert travel each quarter?
- What’s the average time-to-competency for a new technician today?
Establishing these benchmarks is non-negotiable. They are the foundation of your entire ROI calculation.
Working in an Organizational Silo
Finally, do not attempt to build a business case in isolation. An ROI analysis developed by a single department—whether it's operations, IT, or training—lacks the cross-functional buy-in necessary for approval.
Engage other departments early and keep them involved.
- Finance: They can validate your cost assumptions, provide the official discount rate for NPV calculations, and ensure your model aligns with company-wide financial reporting. They are a critical partner.
- Operations: Your frontline managers are the ultimate reality check. They can confirm whether your projected efficiency gains are achievable on the shop floor.
- IT: Bring them in to get accurate costs for infrastructure, support, and integration. This is how you prevent project-killing surprises later.
Collaboration turns your analysis from "your numbers" into "our numbers." It builds a coalition of support that makes getting final approval significantly easier.
Presenting Your ROI Findings to Leadership
You’ve done the hard work. The analysis is complete, and the numbers have been calculated. Now comes the most important step: getting leadership to listen and act.
A brilliant ROI calculation can fall flat if not presented in a way that resonates with your executive team. The key is to move beyond the spreadsheet and build a compelling story. Your goal is to connect the financial returns directly to high-level strategic goals—such as gaining a competitive edge, building a more resilient workforce, or improving operational efficiency.
Craft a Clear and Compelling Narrative
Start with a powerful executive summary. This is often the only part a busy executive will read in detail. It needs to be sharp, direct, and immediately answer the "so what?" question.
Lead with your most critical finding. A 166% first-year ROI or an eight-month payback period will grab their attention instantly. Immediately connect it to a core business objective.
For instance: "This investment delivers a 166% ROI by cutting new hire ramp-up time by 50%, directly addressing our skilled labor shortage."
Your presentation should tell a story of transformation. Frame this investment not as another cost to be managed, but as a strategic move to solve a critical business problem. The financial data is your proof, not the main character.
Visualize Your Data Story
No one is inspired by a wall of numbers. Use visuals to make your data easy to digest and memorable. A simple bar chart comparing "Current Costs" to "Future Savings" will always be more powerful than a dense spreadsheet.
- Use simple charts to highlight key metrics: ROI percentage, NPV, and the Payback Period. Keep them clean and uncluttered.
- Create a timeline visual that clearly shows the break-even point and when the investment starts generating positive cash flow. This makes the return feel tangible.
- Incorporate a quote or a short testimonial from a frontline manager. This adds a human element and validates the operational benefits you're claiming.
When you structure your presentation this way, you shift from being a number-cruncher to a strategic advisor. You’re not just showing them a calculation; you’re showing them a path to real, tangible business value—and turning passive listeners into project champions.
Common Questions About AR/VR ROI
How Do I Quantify Softer Benefits Like Improved Employee Safety?
This is a common challenge, but it's more straightforward than you might think. While you can’t put a price tag on an employee's well-being, you can quantify the cost of an accident.
Look at your company's historical data. What is the average cost of a safety incident? Factor in everything: lost work time, insurance premium increases, workers' compensation claims, and any potential regulatory fines. Once you have that average cost, you can build a realistic projection. If AR-based training can reduce incidents by 10-15%, you multiply that reduction by the cost per incident. This turns a "soft" benefit into a hard, quantifiable number for your ROI model.
What Is a Good ROI for a Technology Investment Like This?
There’s no single answer, as a “good” ROI depends on your company's internal standards. Every business has a hurdle rate—the minimum return required to approve a project. Your ROI must exceed that threshold.
That said, for a newer technology like AR/VR, stakeholders often expect a more compelling return to justify the perceived risk and learning curve. Generally, most companies look for a payback period under 18-24 months. If you can demonstrate that the investment will be recouped in under two years, you have a very strong business case.
Should I Include Employee Salaries in the Initial Investment Cost?
Yes, but only the time directly spent on the project rollout. If your technicians are off the floor for 20 hours to complete their initial AR system training, that is 20 hours of paid time not generating value in their usual role. That time represents a real cost and should be included in your initial investment calculation.
However, do not confuse this with their ongoing salaries, which are operational expenses. The impact on their regular work time is accounted for on the gains side of the equation—through benefits like faster task completion and higher first-time fix rates—not as an upfront cost.
Ready to build a business case that gets approved? AIDAR Solutions provides AR/VR platforms designed to deliver clear, measurable returns by making your training and field support more effective. See how our solutions can start paying dividends for your operations at https://aidarsolutions.com.